Sound in the Time Domain
Amplitude, Frequency, and Phase
Sound is perceived when fluctuations in air pressure cause structures
inside our ears to vibrate. These air pressure fluctuations can be
quite small or large and can occur slowly or rapidly. We refer to the
rate at which pressure fluctuates cyclically from higher to lower to
higher and so forth as its frequency. Typically we express
frequency in cycles per second or equivalently
Hertz. The following figure is a graph of two "cycles" of
fluctuation. This figure shows the Amplitude of air pressure
variations relative to mean air pressure (in no particular units) as a
function of Time (expressed in milliseconds or thousandths of a
second). 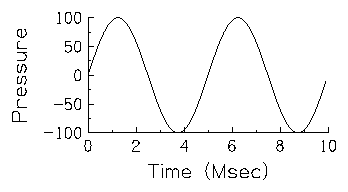 Thus, 0 on the Pressure scale corresponds to the mean air pressure. In
this figure the pressure starts at the average air pressure, increases
to a value of 100 at a time corresponding to about 1.25 msec,
decreases to -100 at 3.75 msec and returns to zero at 5.0 msec before
starting the second cycle. The length of each cycle in time is called
the period of the waveform because the shape of the waveform
repeats periodically at this interval. Since the period of this
waveform is 5.0 msec, there would be 200 periods or cycles in one
second. The frequency of this sound is thus 200 cycles per
second or 200 Hertz (which we will abbreviate as Hz
hereafter). More generally, the frequency of a periodic waveform is
the inverse of its period; F = 1/P or in this example, 200 = 1.0 /
0.005. If you would like to hear what this 200 Hz waveform sounds
like, click on the graph with your mouse or pointer.
In addition to the frequency of a sound, we can
describe its amplitude. In general, small variations in
pressure produce weak (or quiet) sounds while large variations produce
strong (or loud) sounds. The next figure shows another sound which is
lower in amplitude that the previous example because the
pressure varies less extremely over time. 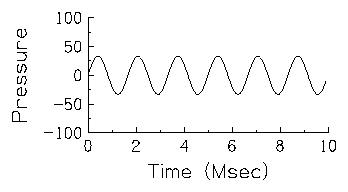 This figure shows a sound which also
differs in frequency from the sound illustrated in the previous
figure. Note that frequency and amplitude vary independently. Although
the amplitude is lower in this figure, the pressure fluctuations are
more rapid than in the previous figure; six cycles occur within ten
msec so this tone has a frequency of 600 Hz. Consequently, this sound
is higher in frequency but lower in amplitude than the sound depicted
in the first figure.
One other property called phase is important in describing the
physical properties of sound. To illustrate what is meant by phase,
the next figure shows two 200 Hz sinusoids, one drawn with a solid
line and the other drawn with a dotted line.  The two sinusoids are identical
except that they are differently aligned with respect to the time
axis. These two sinusoids are said to differ in phase while having
the same amplitude and frequency. This is a good moment to point out
that the notion of `beginning' and `ending' needs some qualification
here. The figures drawn on this page have waveforms which obviously
begin and end within the limits of the graph. However, they represent
snippets of functions which do not have beginning and ending
points. Thus, the phase differences shown in the present figure do not
reflect the notion that one function started at a different
time than the other. Rather, the phase differences represent the way
the two functions are aligned with respect to each other at all times,
including those which lie outside the bounds of the present graph.
The physical properties of amplitude, and frequency correspond to
the sensory/perceptual qualities of loudness and
pitch. It is often useful to maintain a clear distinction
between the physical properties of sound and the perceptual correlates
of those properties. For one thing, the perceptual domains of pitch
and loudness are bounded by the capabilities of our auditory systems
whereas the physical properties of sound are not. The
normal young human auditory system is sensitive to a range of
frequencies from about 20 Hz to about 20,000 Hz. The amplitude range
is substantially broader, beginning at a level so low that we can
almost "hear" the fluctuations in air pressure due to random motion of
air molecules near the ear drum and extending to the threshold of pain
at about 10 million times that level.
A second important difference between the perceptual properties of
sound and its physical properties is that even within the bounds of
the perceptual system, the relationship between the perceived and
physical properties of sound is generally non-linear. For example, if
we increase the amplitude of a sound in a series of equal steps, the
loudness of the sound will increase in steps which seem successively
smaller. Similarly, increasing the frequency of a sound in equal steps
will lead to perceived increases in pitch that seem to grow smaller
with each step. Here's an example. Click on any of the following
numbers to hear a tone of the corresponding frequency. Note that as
you go through these tones in 25 Hz steps, the steps sound like they
are getting closer together. For instance, compare the step between
200 and 225 Hz with the step from 400 to 425 Hz. The step from 200 to
225 sounds larger than the step between 400 and 425 Hz even thought
both are exactly 25 Hz.
200Hz 225Hz 250Hz 275Hz 300Hz 325Hz 350Hz 375Hz 400Hz 425Hz 450Hz 475Hz
Whole Series
We often describe sounds using scales that reflect equal
perceptual differences. For frequency, one such scale is the
Mel scale. Equal Mel steps will correspond to equal changes in
pitch, but not equal changes in frequency. Similarly, for loudness, it
is most convenient to describe sound over the enormous range of
perceptible amplitudes in logarithmic units called Decibels and
abbreviated dB. On the decibel scale, 0.0 dB corresponds to
about the normal threshold of hearing and 130 dB to the point at which
sound becomes painful. Moreover, each 1 dB step corresponds to
approximately a Just Noticeable Difference in loudness, that
is, the smallest change in loudness that is noticeable about 50% of
the time.
The third physical property of sound, its phase is less directly
related to perceived sound quality. In most work related to speech
perception, phase is entirely disregarded. However, phase is important
in describing how complex sounds can be constructed from the simple
sinusoidal sounds we've discussed so far.
Simple versus Complex Sound
Despite their differences in amplitude and frequency, the sounds
shown and heard above depict simple sounds because the pressure
fluctuations associated with these sounds are sinusoidal. That is, the
pressure variations over time follow the form of a trigonometric sine
or cosine function. Most sounds in nature are not so simply described;
their shape, rather than being sinusoidal, is of some other form,
typically one for which we have no name. Fortunately, it turns out
that such complex sounds can be described mathematically as
combinations of simple sounds. Consider for example, the sound
illustrated in the next figure which simply alternates between a
region of constant high pressure and a region of constant low
pressure. 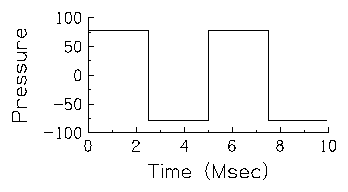 This particular waveform does have a name,
it is called a square wave because of its boxy shape. This
square wave is very similar to the 200 Hz sine wave shown in the first
figure in that it too repeats a single pattern two hundred time a
second. Moreover, (if you haven't already listened to it, you should
now) it has the same pitch as the 200 Hz sine wave, but a different
timbre.
This complex square wave can be described as the summation of a set
of simple sinusoids. In other words, the square wave can be formed by
adding together sinusoids of the appropriate amplitude, frequency, and
phase. Not surprisingly, the first and strongest sinusoid needed to
form the square wave in our example is a sine wave of 200 Hz. This
first component corresponds to what is called the Fundamental
Frequency (hereafter abbreviated as F0) and is the frequency
which gives rise to the pitch we normally hear when listening to a
complex sound. Thus, the common F0 accounts for the pitch similarity
between the 200 Hz sine wave and the 200 Hz square wave. To construct
a square wave we need, in addition to a 200 Hz sine wave, a sequence
of higher frequency sine wave components. The components in this
sequence are called overtones or harmonics, and by definition,
can only occur at integer multiples of F0. Since F0 in this example is
200 Hz, the harmonics can only occur at 400 Hz, 600 Hz, 800 Hz, and so
forth. However, the square wave is a special case in that all of the
even-multiple harmonics (i.e., the ones at 2F0, 4F0, 6F0, etc.) have
zero amplitude so they contribute nothing to the shape of the square
wave.
Using only the odd-numbered harmonics then, we can construct a
square wave by adding sine waves at F0, 3F0, 5F0, and so forth. For
our example 200 Hz square wave, this means we need sine waves at 200
Hz, 600 Hz, 1000 Hz, 1400 Hz, and on. In addition to having harmonics
of the correct frequencies, the amplitude relations among the
harmonics must be correct or we will not construct the desired
waveform. For a square wave, the 3rd harmonic (at 600 Hz) should be
1/3 the amplitude of the fundamental. This is exactly the sinusoid
shown in the second figure above. 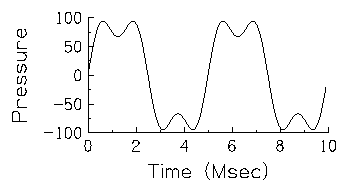 Here is the waveform that results from
adding a 200 Hz sine wave with a 600 Hz sine wave at 1/3 the
amplitude. Already, the combined waveform is beginning to take on some
features of the square wave with a more extended portion near its most
positive and negative values (albeit still with much fluctuation).
Continuing to build a square wave by adding sinusoids, the third
component needed (the fifth harmonic at 1000 Hz) should be 1/5 the
amplitude of the fundamental, and the fourth sine wave, corresponding
to the 7th harmonic (at 1400 Hz) should be 1/7 the amplitude of the
fundamental. These are shown in the next set of figures along with the
square wave approximations when we sum all harmonics up to and
including the given harmonic.
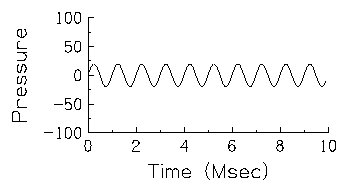
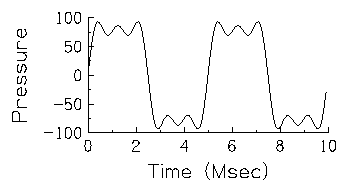
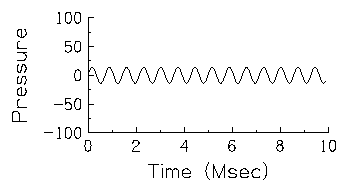

As you can see, with the addition of each subsequent harmonic, the
complex waveform more nearly approaches the shape of a square
wave. The addition of each higher frequency harmonic reduces the amplitude (and
increases the frequency) of the small ripples in the more stationary
parts of the square wave. To achieve the shape of a true square wave
with absolutely no ripple in the stationary parts would require the
summation of an infinite number of sinusoids. But we don't have time
for that in the present tutorial.
Last Modified: February 21, 1996
 This figure shows a sound which also
differs in frequency from the sound illustrated in the previous
figure. Note that frequency and amplitude vary independently. Although
the amplitude is lower in this figure, the pressure fluctuations are
more rapid than in the previous figure; six cycles occur within ten
msec so this tone has a frequency of 600 Hz. Consequently, this sound
is higher in frequency but lower in amplitude than the sound depicted
in the first figure.
 Thus, 0 on the Pressure scale corresponds to the mean air pressure. In
this figure the pressure starts at the average air pressure, increases
to a value of 100 at a time corresponding to about 1.25 msec,
decreases to -100 at 3.75 msec and returns to zero at 5.0 msec before
starting the second cycle. The length of each cycle in time is called
the period of the waveform because the shape of the waveform
repeats periodically at this interval. Since the period of this
waveform is 5.0 msec, there would be 200 periods or cycles in one
second. The frequency of this sound is thus 200 cycles per
second or 200 Hertz (which we will abbreviate as Hz
hereafter). More generally, the frequency of a periodic waveform is
the inverse of its period; F = 1/P or in this example, 200 = 1.0 /
0.005. If you would like to hear what this 200 Hz waveform sounds
like, click on the graph with your mouse or pointer.

 This particular waveform does have a name,
it is called a square wave because of its boxy shape. This
square wave is very similar to the 200 Hz sine wave shown in the first
figure in that it too repeats a single pattern two hundred time a
second. Moreover, (if you haven't already listened to it, you should
now) it has the same pitch as the 200 Hz sine wave, but a different
timbre.


